by Steve on Thu 16 February 2017
Designing and implementing a marketing campaign or website is a creative, daunting task. The ability to analyze and view results of your decisions is critical in a successful effort. The Spotlyte Analytics tools can assist you in answering the critical question of the audience reach and exposure across social media, as well as low level engagement metrics related to web interactions.
We'll look at both the Social and Engagement analytics available in Spotlyte and describe where each one is most useful and how they can simplify and improve your next campaign.
Social Analytics
Social analytics measures how well your campaign is engaging users and audience through standard social media measures, including likes, reach, activity, and influence.
Spotlyte provides a quick view into the effectiveness of your campaign.
The Activity Graph provides a quick look at the volume of posts over time. This insight is useful to know which days during your campaign was your audience or followers most active. Was there any trigger that might have caused any of the spikes ( or dips ) in activity? For example, did some parallel ad campaign, or publication generate a lot of social media activity. Were there other coordinated efforts that can correlate with the uptick in activity, or conversely did certain marketing activities not have any intended effect. This type of information can be helpful as you continue your campaign, or plan out future campaigns.

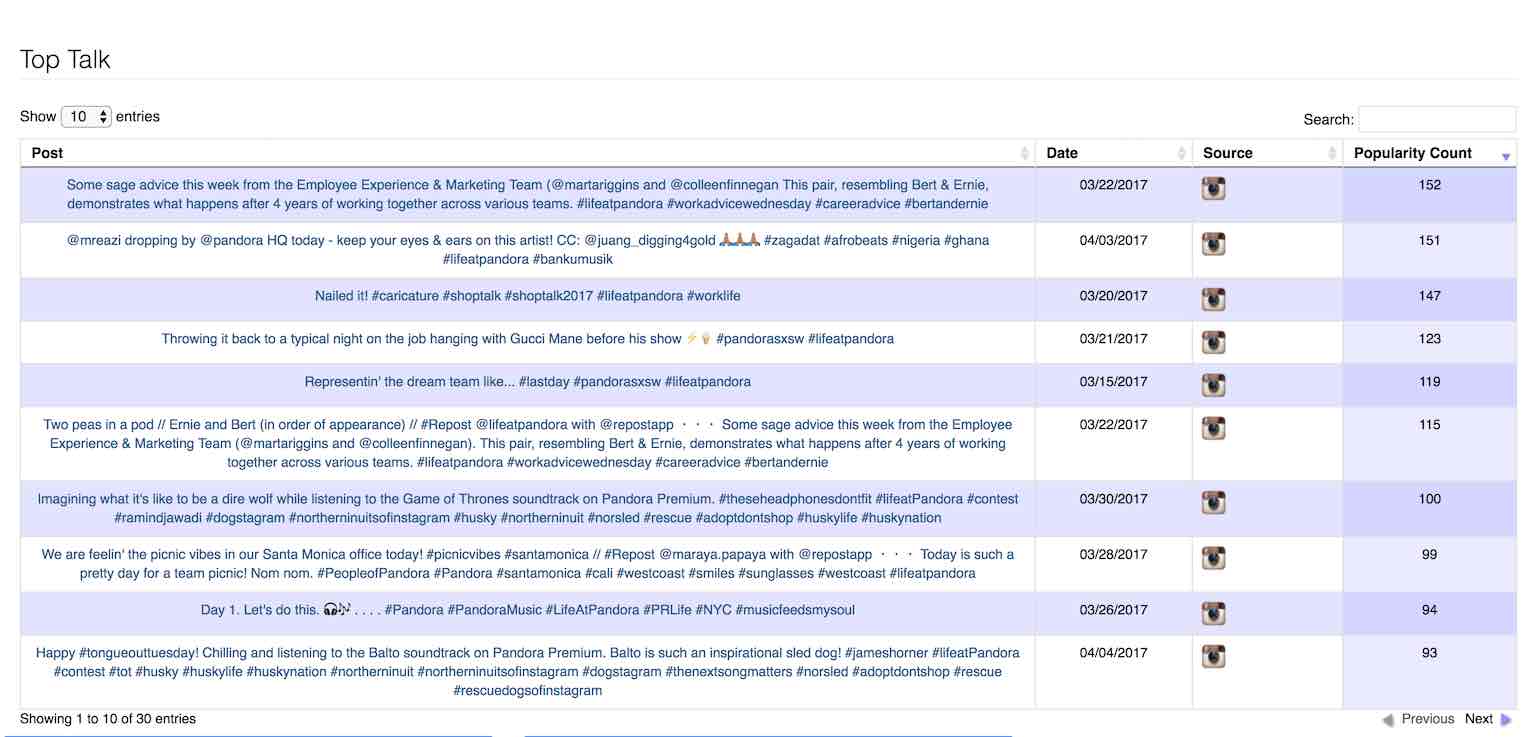
Taking a more detailed look into the individual posts and conversations occurring around your, can show what your audience is most engaged or interested in. Spotlyte takes a measure of all the likes, retweets, and comments that a post accumulates and ranks the most popular post during your campaign.

Viewing your most engaged posts can be useful in a couple of ways:
- Determining where your audience's interest lies, to solicit further conversation down the road
- For contests, it's sometimes easy to say the top popular posts in some combination with judging are your winners, and this table provides it immediately for your team to judge
In the age of hashtags, it's important to know which hashtags you're audience is using. Often times this may not be the one you advertised or are pushing, or you may discover there's other hashtags being used that you may wish to monitor as well. Using the word and hashtag clouds, you'll get a a clear picture of the most popular words and hashtags that are being used by the social media activity around your brand.

Use the word clouds and create new Categories. to track and monitor further sub discussions and activity occurring around your brand.
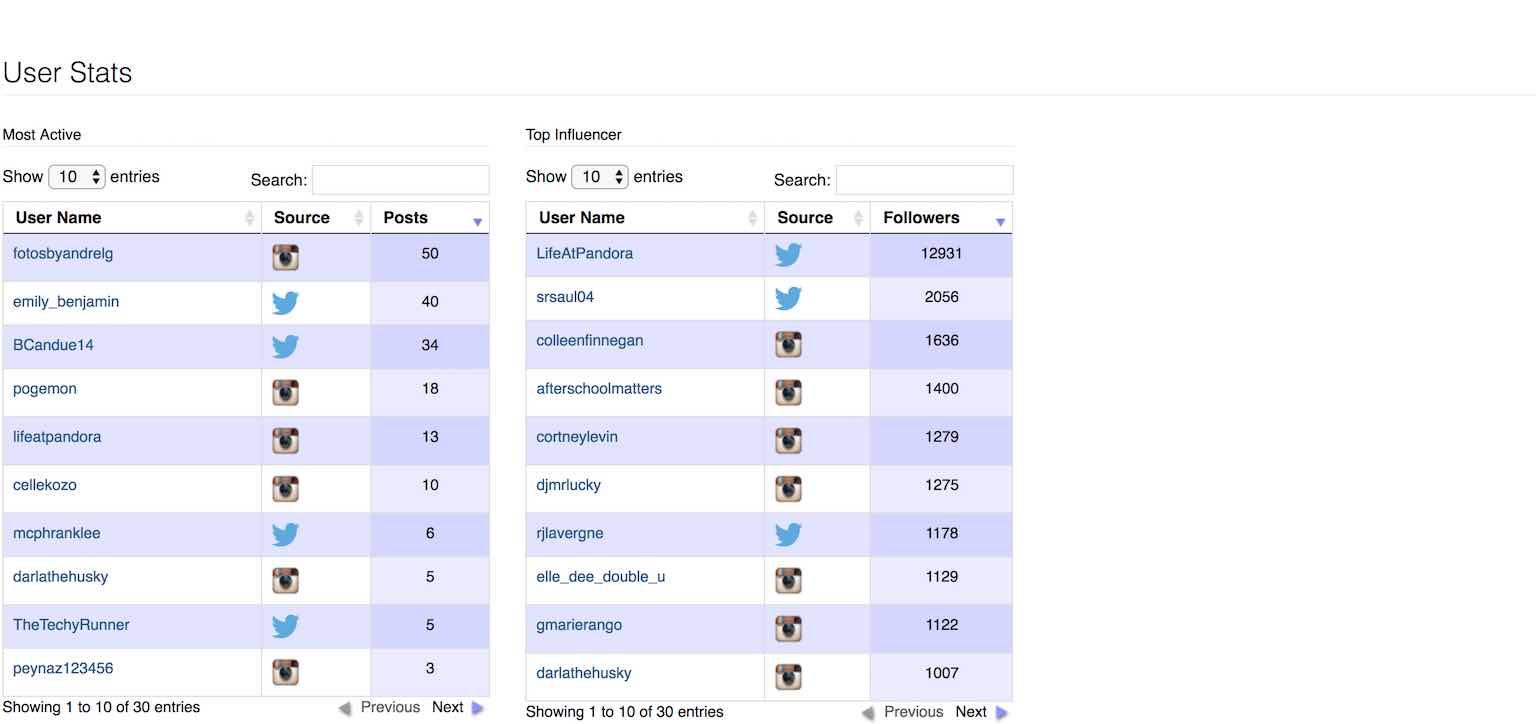
We've looked at the volume of social media activity, the most popular or engaged content, and individual words within the activity. But of course, your users and fans are what matters most. So the next tables provide a view into which users are most active within your campaign and which users are your best influencers.

Discovering this information can:
- help you engage and have further dialogue with your most supportive fans
- connect with influencers that are engaging and talking about your brand to hopefully spread your brand farther. Remember, influencers on social media are quite important to a successful campaign.
- help in contests, by selecting the most active users in combination with human judges as winners
Using your Spotlyte Social Analytics is a valuable and productive way to help build effective marketing campaigns. They are also useful in obtaining metrics on the effectiveness of your current and past social media marketing activities.
Engagement Analytics
The other form of analytics that Spotlyte provides is for website engagement analytics. These are for situations where you may have embedded a Spotlyte widget onto your webpage for visual marketing, boosting product sales with social reviews, and utilizing user generated content for product marketing. Spotlyte provides the tools to quickly and easily build websites incorporating these widgets that bring together social and user generated content.
The most proven form of advertising is simply word of mouth from your friends, or barring that, from actual users who you know have tried a certain service or product. Being able to then embed user generated content related to your product categories is a very effective means to show the popularity of your store.
This type of analytics can be useful in other situations beyond just visual product marketing. Being able to tell exactly which social media tiles and posts that your website visitors are engaging with can again help your marketing tactics during your campaign.
Spotlyte's Engagement Analytics is the tool that provides this type of useful information on whether your visitors are clicking on certain product tiles, which posts or products are obtaining the most clicks, which pages are being visited the most, etc:

Engagement analytics tracks several variables, including:
- Page Views: shows how often a certain page on your campaign website is being visited. This is the most generic engagement data and should typically be used as a directional information of your website's effectiveness. You can then use this in the denominator of the other metrics below to obtain the percentage of your visitors who are engaging with your site.
- Page Loads: just knowing a user visits a page is important, however, often it is also important to know how engaged they are with your content. Page loads measures the number of posts or tiles the user has scrolled or accessed. This can be a good indication to how 'sticky' your content, or your user generated content is for your visitor.
- Post Clicks: Clicks show how many posts your users click. Or if you're using the "Call To Action" feature on posts, it also shows how many of your Call To Actions are being clicked on by your visitor. This is a good indication of the popularity of certain products or content in your website.
- Hovers: Mouse hover is a lower indication of popularity of particular product or content. It indicates a user hovered over a piece of content maybe to read more, but may not have had enough interest to click through. This can be used to provide a light guidance on which pieces of content to improve, or imagery/descriptions to enhance.
Spotlyte Social Media Analytics and Engagement Analytics are two tools in the our platform that can help guide your social media marketing and web design decisions. Having these valuable metrics at your finger tips can save you a lot of wasted time and headache in helping you figure out how to execute your campaign, conduct your contest, or design your webpage.
Interested in where we're taking our analytics suite next? Follow us on Twitter at @getspotlyte to stay informed.